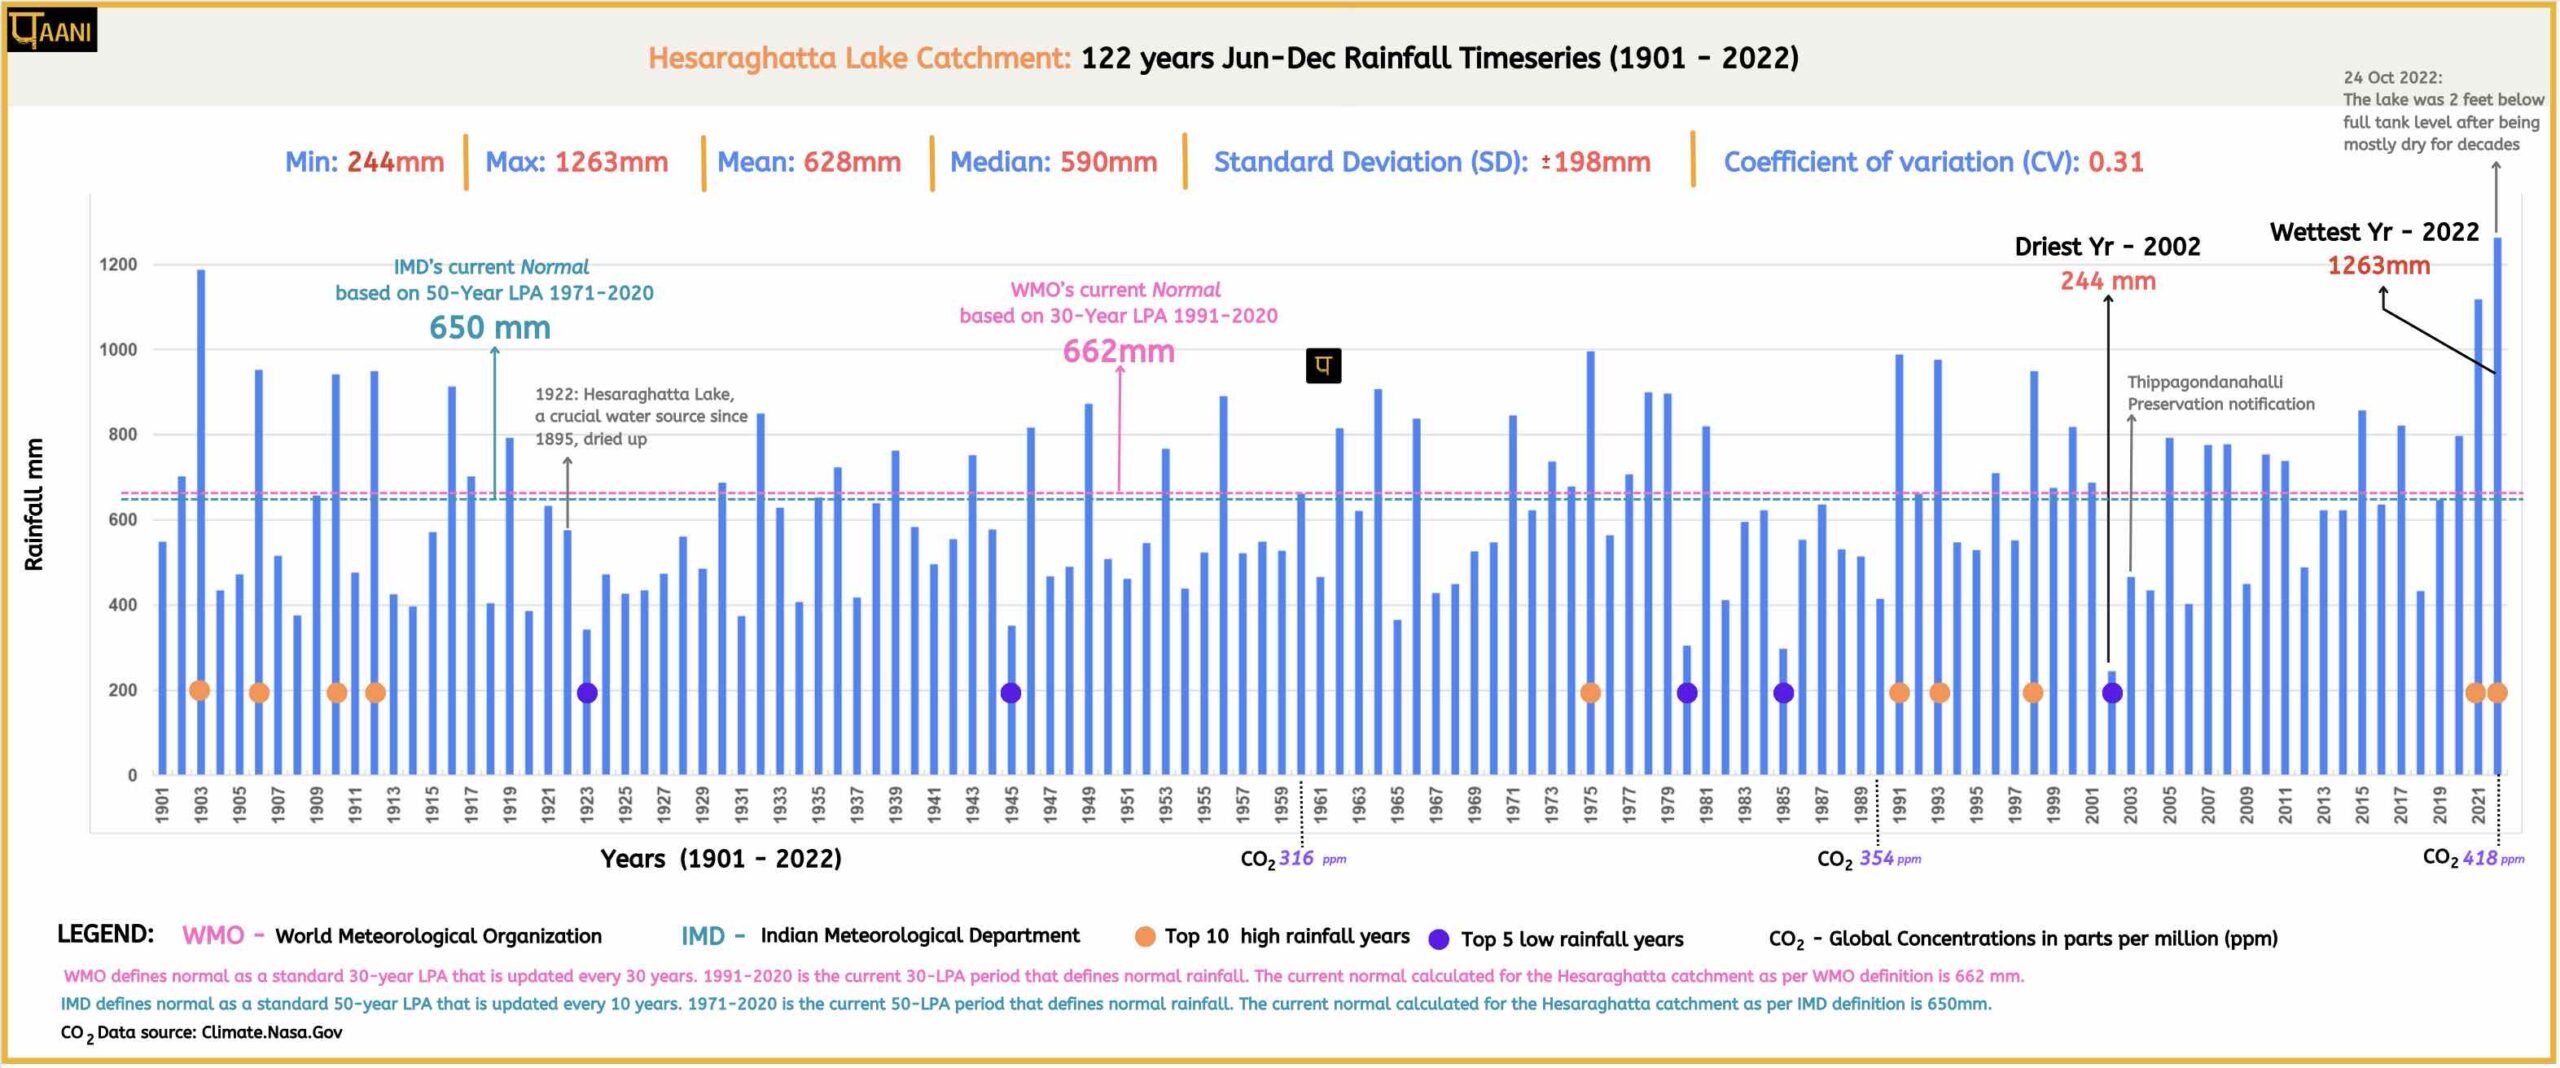
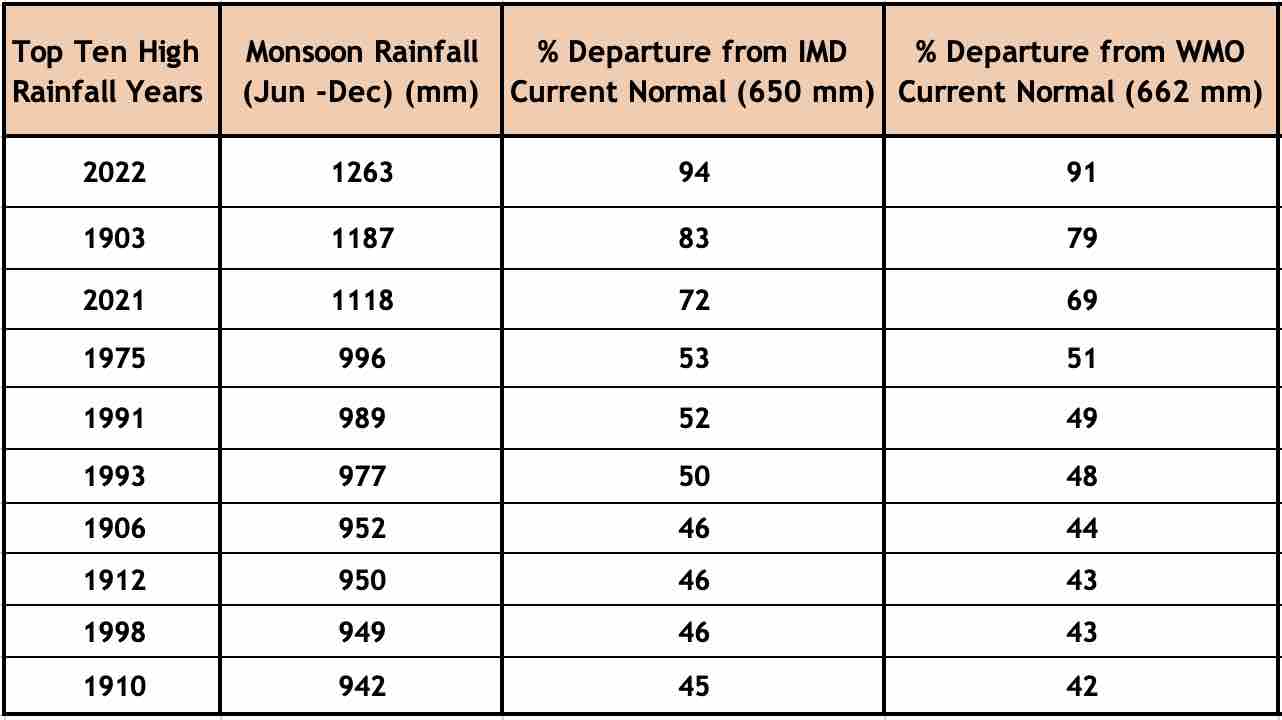
With a recorded rainfall of 1263mm, 2022 marked a remarkable 94% departure from the IMD’s normal of 650mm. Similarly, 2022 deviated by 91% from the WMO’s normal of 662mm. The IMD’s current normal of 650mm is based on the 50-year LPA from 1991-2020, while WMO’s normal of 662mm is based on the 30-year LPA from 1991-2020.
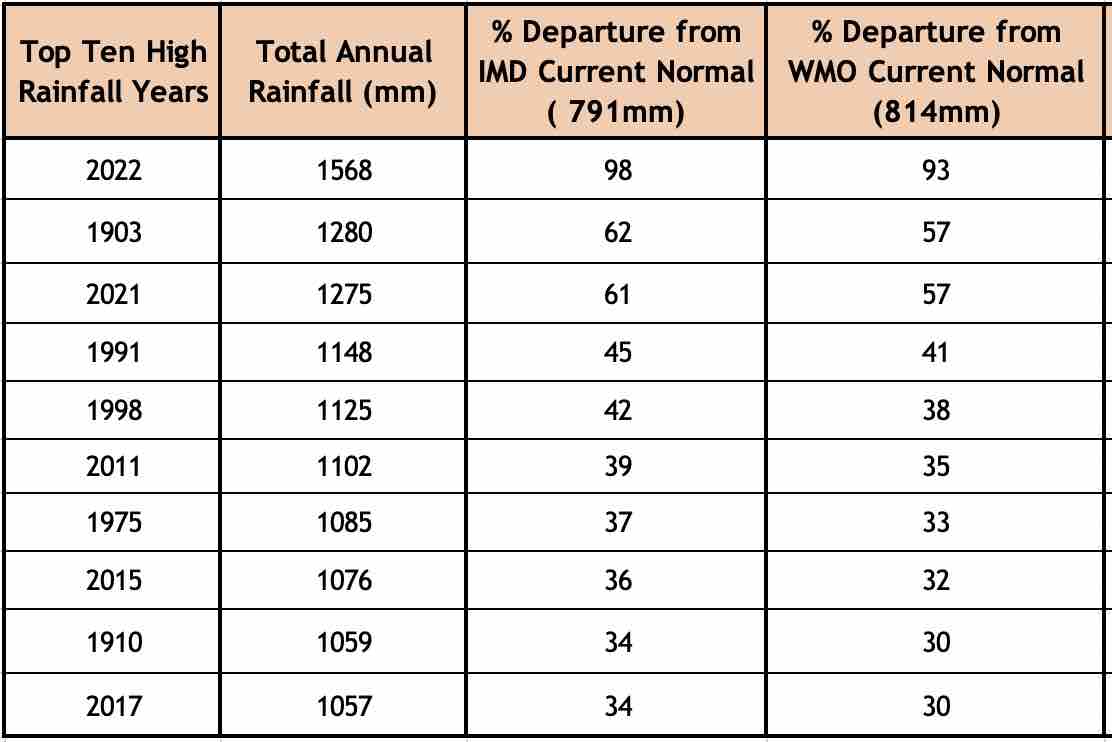
It can be observed from Table 2, that the percentage of departures in 2022 far exceeds any other year on record.