Rivers, Lakes and Watersheds of Anekal Taluk
Updated Date: 12 May 2023
The Rivers, Lakes & Watershed of Anekal Taluk map-data visualization shows, as the name says, Rivers – Chinnar, Suvarnamukhi & Dakshina Pinakini, 285 lakes and their cascading connectivity and five watersheds spread over ~533 sq. kms of Anekal Taluk. The lake area, capacity, and custodian are given. Stressors such as Industrial Areas, Quarries,Industrial Common Effluent Treatment Plants, Industrial & Municipal Sewage Treatment Plants & Transport Infrastructure like roads & railways are marked.
This map has been possible because of the support of numerous activists who work on the ground. We thank them for their warm support and infinite patience!
Click here to load the map. Scroll down to read the map-narrative
The Rationale:
Anekal Taluk is an extremely water-stressed region. The surface water is seriously polluted with potent forever chemicals, including active pharmaceutical ingredients, and is unusable. In addition, groundwater is both polluted and overexploited. Therefore, understanding & quantifying the state of water resources in the region is fundamental to addressing water stress & mitigating pollution.
National Green Tribunal (NGT) registered a suo-moto case on the severe pollution of Chandapura Lake in Anekal. It constituted a 7-member committee comprising of Central Pollution Control Board (CPCB), Karnataka State Pollution Control Board (KSPCB), Indian Institute of Science (IISC) – Bengaluru, State Environment Impact Assessment Authority (SEIAA), National Wetland Authority, State Wetland Authority, and the District Magistrate of Bengaluru Urban to ascertain facts. A review of the 7-member committee report submitted to NGT revealed a huge gap in the government’s understanding and acknowledgment of the pollution crisis.Therefore, understanding & quantifying the state of water resources in the region is fundamental to addressing water stress & mitigating pollution.
The committee showed no technical competency in establishing the nature of pollution. Despite having all the geospatial resources, the report failed to represent a basic catchment map of Chandapura Lake, identify stressors like open pit quarries and industrial areas, and quantify the land use, all of which are needed for water pollution assessment and quantification.
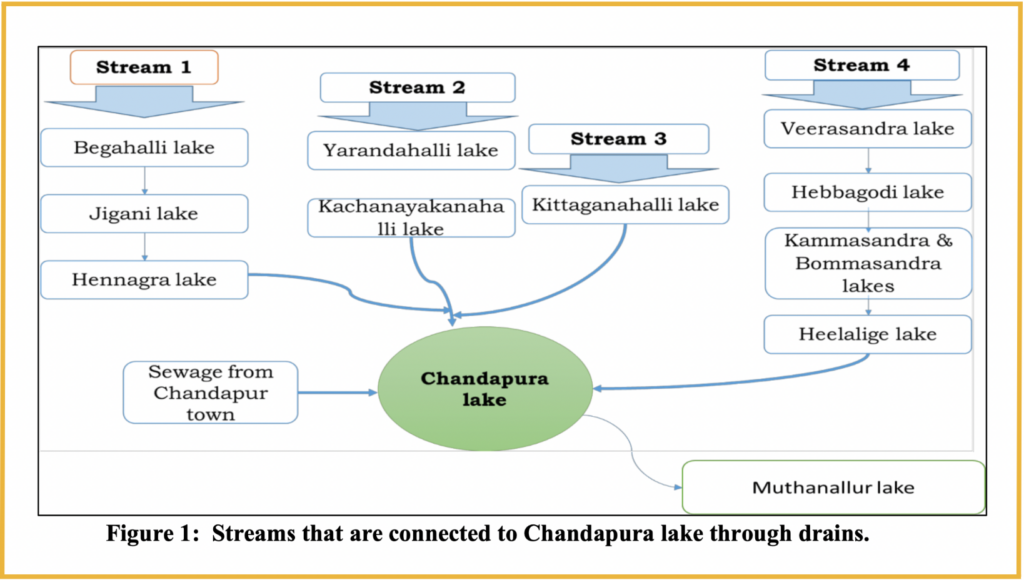
The figure 1 on the left shows the Karnataka government’s inept and incomplete representation of Chandapura Lake Catchment in the 7-member committee report. Such half-baked & apathetic reports greatly compromise sustainable & appropriate actions. It may be because of this incompetency, coupled with apathy, that NGT imposed a Rs 500 Crore fine on the Karnataka government for failing to protect Chandapura Lake.
In another NGT case, OA 360/2018, the states were directed to prepare district environment plans, which would form the basis for state environment plans. The state environmental plans would form the country-level environmental plan’s basis. The environment plans requires an inventory of water bodies as a basic data point and this inventory, if it exists, is not in the public domain.
Last year we attended a series of meetings hosted by Bengaluru Urban Zilla Panchayat concerning lake restoration in Anekal & other taluks. Unfortunately, a spatial inventory of waterbodies -a key element for waterbody restoration- was not used as a datapoint in any of the meetings for decision-making, despite the presence of the government’s own geospatial resource in the meetings.
When this is the state of decision-making, citizens must develop and maintain a spatial inventory of waterbodies and use it while working with the government to influence decision-making. Such spatial inventory must be easily readable and publicly accessible, so the citizens can ascertain the gap between: What the government is doing and What it ought to be doing?.
And that’s why we built the ‘Rivers, Lakes & Watersheds of Anekal Taluk’ Map-visualization.
Also See: The detailed Map of Koramangala-Challaghatta Watershed. Also known as Bellandur-Varthur Watershed Map.
The Map:
Click Image below to load the ‘Rivers, Lakes and Watersheds of Anekal Taluk’ map-data visualization. Scroll down for the narrative on the 19 useful data points marked on the map.
Frequently Asked Questions(FAQs) are at the bottom of the page. Please refer to them and read the narrative before writing to us.
The nineteen (19) useful data points:
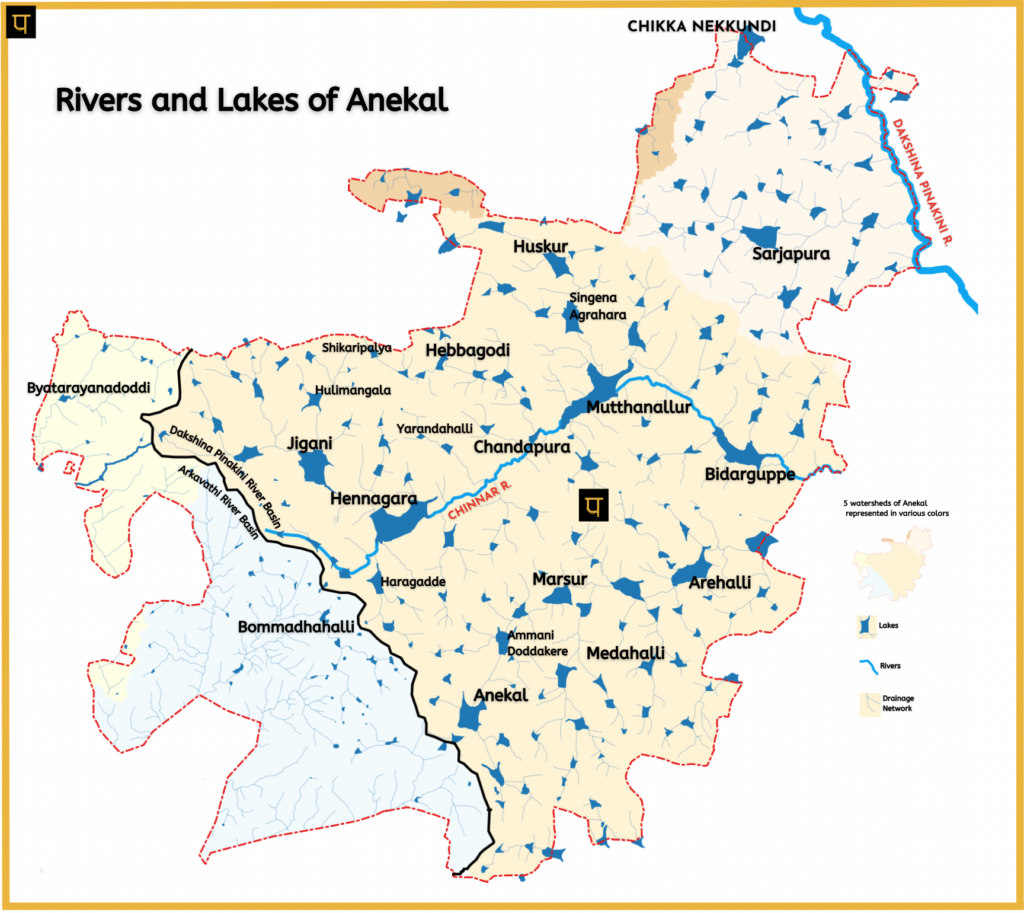
1. Administratively, Anekal Taluk is in Bengaluru Urban District, as highlighted in orange, in the image below. The shape of the map (the red boundary line on the map-visualisation) is the administrative boundary of Anekal Taluk, spread over 533 sq kms. Anekal Taluk boundary is sourced from Karnataka State Remote Sensing Application Centre (KSRSAC).
From a river basin perspective, 77% of Anekal Taluk is in the Dakshina Pinakini Basin, as highlighted in orange, in the image below, of Dakshina Pinakini River Basin. The rest, 23% of Anekal Taluk is in Arkavathi Basin.

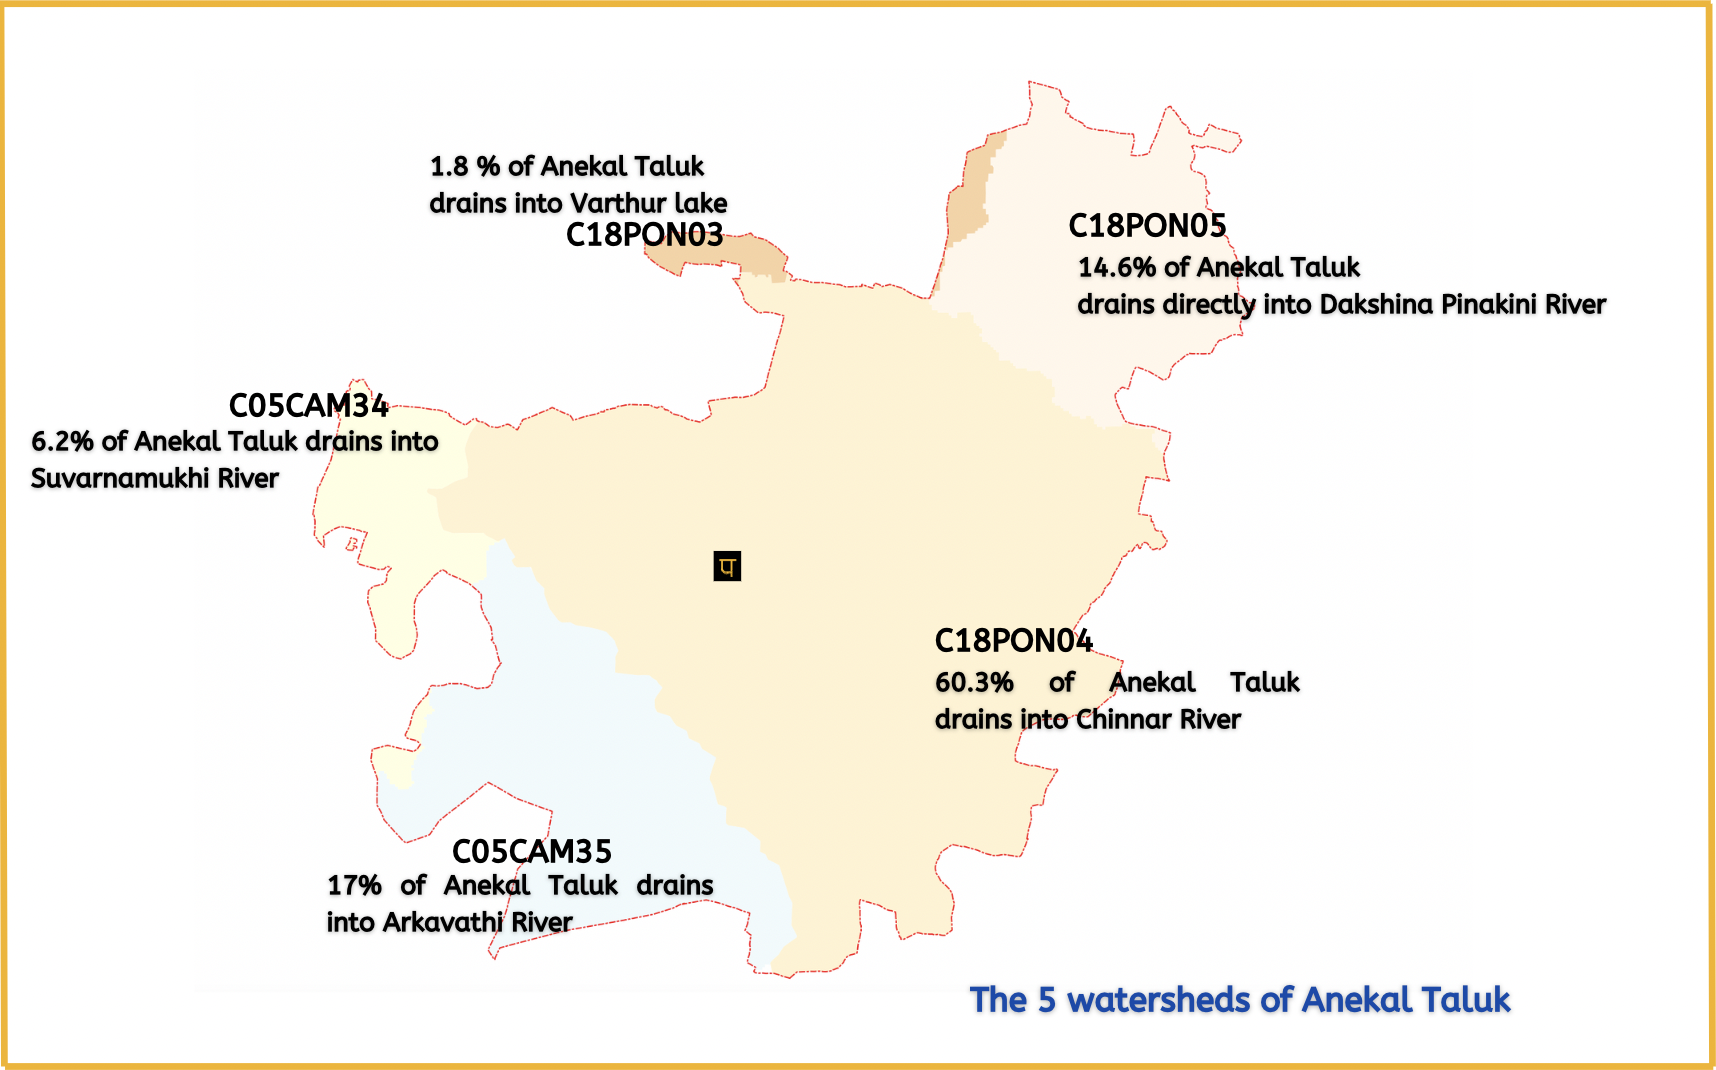
2. Watersheds: Anekal Taluk has five watersheds, as depicted in 5 colors in the image below. The five watershed codes are the codes given to watersheds by IndiaWRIS.
Two watersheds are in the Arkavathi River Basin, while three fall in the Dakshina Pinakini River Basin. Chinnar River basin (C18PON04) is the largest watershed in Anekal, occupying roughly 60% of the taluk.
3. Drainage: Anekal Taluk base drainage is from IndiaWRIS. This base drainage is validated & harmonized using Cadastral maps (Survey done in 1900’s) and Survey of India Toposheets (D43X13_57H13, D43X9_57H9, D43X10_57H10, D43X14_57H14). Extensive ground truthing was done over the course of 5 months based on which drainage is harmonized. The drainage harmonization does not mean that the drainage is representative of the drainage on the ground, which is altered by industrialization and urbanization. It means that the drainage alteration is acknowledged by ground truthing, but a decision has been taken to retain the original drainage in most cases, while a few are updated. One such update is the drainage downstream of lakes -Muthanallur Amanikere and Gopasandra_104.
The drainage is in blue and grey colors. Some of the lower-order streams are represented in grey (which fades into the background) to improve the map’s readability.
4. Rivers of Anekal: Dakshina Pinakini, Chinnar & Suvarnamukhi are some of the rivers of Anekal.
- The 46.5 kms long Chinnar River flows for 29.5 Kms in the Anekal. Hennagara, Muthanallur Ammanikere & Bidarguppe are some of the big impoundments on the Chinnar River managed by the Minor Irrigation Department.
- The 34 Kms long Suvarnamukhi River flows for approx 3.5 kms in Anekal.
- Antaragange & Muttiyalamma streams, tributaries of the Arkavathi river, begin their journey in Anekal.
Also See: The map and data of Vrishabhavathi River, of which Suvarnamukhi river is a Tributary
Also See: The map and data of Arkavathi River Basin.
Also See: The map of Dakshina Pinakini River Basin.
5. Lakes of Anekal: The map identifies 285 lakes whose area is greater than 3 acres.
Lake names are unique. However, some lakes have the same name, and to uniquely identify them, the lake name is suffixed with the lake survey number as done by Anekal Gram Panchayat Office.
- Survey of India toposheets (D43X13_57H13, D43X9_57H9, D43X10_57H10, D43X14_57H14)
- European Commission’s Global Surface Water Explorer
- Bhuvan’s Water Bodies Information System
- Karnataka State Remote Sensing Application Centre’s (KSRSAC) Cadastral Map and Tank Information System (TIS)
- Shri K.B Koilwad’s Committee report on matters related to encroachments and Conservation of waterbodies in Bengaluru Urban and Bengaluru Rural districts.
- National Wetland Atlas: Karnataka, Space Applications Centre (ISRO), Ahmedabad, India.
6.Lake Custodian: Of the 285 lakes of Anekal Taluk
- Two hundred fifty-six (256) come under the jurisdiction of Zilla Panchayat (marked as blue on the Map).
- Twenty-seven (27) are under Minor Irrigation (marked as green).
- Two (2) are Bruhat Bengaluru Mahanagara Palike (BBMP) (marked as Orange).
Note: Harluru, Kasavanahalli, Gunjur, Parapanna Agrahara & Halnayakanahalli lakes are outside of Anekal and are marked for context and are not included in the count. Some lakes, like Attibele, are spread over both Anekal Taluk in Bengaluru Urban district of Karnataka and Krishnagiri district of Tamilnadu and are counted.
7. Area: The Lake area on the map is in Acre-Gunta format. The area data is extracted from Shri K.B Koilwad’s Committee report on matters related to encroachments and the Conservation of waterbodies in Bengaluru Urban and Bengaluru Rural districts.
8. Live Capacity: Each of the twenty-seven Minor Irrigation (MI) Lake’s live capacity is shown on the map in Million Cubic Feet (MCFt). The totalMI live capacity in the taluk is 794.28 MCFt. The data is from the Minor irrigation document published on 1st Apr 2012, listing details of all the minor irrigation tanks in the state, which we now have.
9. Bannerughatta National Park: Approx. 5.8% of the taluk is occupied by Bannerughatta National Park, as shown on the map. If we included the National Park’s Eco-Sensitive Zone (ESZ), 12.5% of the Taluk area would come under the national park & its ESZ. The national park boundaries are sourced from KSRSAC.
10. Stressors: The map spatially identifies stressors (or factors) that pollute the water: Industrial Areas, urban centers, open-pit quarries, and roads.
11. Industrial Areas: The Karnataka Industrial Area Development Board (KIADB)’s major industrial areas: Jigani, Bommasandra & Attibele, are marked. The KIADB industrial areas data is sourced from KSRSAC. The industrial areas of Anekal host a range of highly polluting pharmaceutical and chemical industries. A continuous flow of Industrial effluents, Industrial sewage, and the indiscriminate dumping of industrial sludge and solid waste, sludge including hazardous waste, puts enormous stress on the waterbodies.
There are 13 numbers of highly polluting industries (which is classified by Central Pollution Control Board as 17 category) operate in the industrial area of which 11 are Bulk drug /Active Pharmaceutical Ingredients manufacturing industries as shown in the list below:
- Apotex Pharmachem India Private Limited, Bommasandra Industrial Area.
- Biocon Limited, Plot No. 2, 3, 4 & 5, Bommasandra – Jigani Link Road.
- Syngene International Private Limited, Bommasandra – Jigani Link Road.
- Cipla Limited, Bommasandra – Jigani Link Road.
- Micro Labs Limited, Bommasandra – Jigani Link Road.
- Acebright India Pharma Pvt Ltd., Jigani Industrial Area.
- Kumar Organic Products Private Limited, Jigani Industrial Area.
- Kumar Organic Products Limited, Jigani Industrial Area.
- Stellance Pharmascience Ltd., Jigani Industrial Area.
- Hikal Ltd., Jigani Industrial Area.
- Biocon Limited, K.M., Hebbagodi.
- Anthem Biosciences Private Limited, Bommasandra Industrial Area, II Phase.
- Bal Pharma Limited, Unit-II, Bommasandra Industrial Area.
13. Common Effluent Treatment Plants (CETP): CETPs treat toxic industrial effluents. Anekal Taluk hosts one CETP, VIWA Eco-Club (Veerasandra Industrial Area) of 20 Kilolitre/day installed treatment capacity, is marked on the map (See above Hebbagodi Lake). The 2020-2021 Annual report of the Karnataka state pollution control board does not acknowledge this CETP, while the 2019-2020 Annual report documents it as operating.
In 2019, in the matter of NGT OA No. 593/2017 (Paryavaran Suraksha Samithi & Anr. v/s Union of India & Ors), Central Pollution Control Board found Viwa Eco-club to be non-compliant, while Karnataka state pollution control board found it to be compliant. In conclusion, the regulatory monitoring of CETPs is lax, and the potent water pollution caused by such units is unacknowledged and unquantified.
14. Urban Centers: The urban centers are marked on the map. The taluk has:
- 1 City Municipal Council (CMC): Hebbagodi.
- 5 Town Municipal Council (TMC): Bommasandra, Attibele, Jigani, Chandapura & Anekal.
- Census Towns (CT): Sarjapura, Maragondanahalli & Dommasandra
Raw domestic sewage from these urban centers flows into the water bodies. In addition, mismanaged municipal solid waste (including plastics, chicken waste, etc.) is dumped indiscriminately on lakes and streams, putting enormous stress on the waterbodies.
15. Sewage Treatment Plants (STP): Anekal Taluk has three sewage treatment plants, as marked on the map. The STP data is sourced from various KSPCB documents and its existence verified on the ground.
- Golden Enviro, a private STP,has a 100 Kilo Litre/ Day Installed Treatment Capacity (see above Hennagara Lake). This STP treats industrial sewage. At the time of writing this, we cannot ascertain the working conditions of the STP.
- Karnataka Urban Water Supply & Drainage Board (KUWS & DB) implemented 3.3 MLD (Million liters per Day Installed Treatment Capacity) on the bank of Chinnar River. This STP is not functional at the time of writing this.
- Karnataka Urban Water Supply & Drainage Board (KUWS & DB) implemented 3.1 MLD (Million liters per Day Installed Treatment Capacity) established on the lake bed of Haladenahalli Lake. It is found to be erratically functional at the time of writing.
16. Open Pit Stone Quarries: Open pit quarries are identified from the European agency’s sentinel Satellites and Google Earth imagery. The map shows the western part of Anekal, in the Arkavathi catchment, where most open-pit quarries are located. Some quarries are inside the Bannerughatta National Park, and many are immediately outside (in the park’s eco-sensitive zone). The waste generated by quarry activities has high concentrations of toxic heavy metals, which then get washed away to the nearest water bodies.
17. Transport Infrastructure: Transport infrastructure like roads is a major source of unquantified water pollution that receives zero attention, and thus roads are marked. Some roads marked are Hosur Road, Bannerughatta Main Road, Anekal-Attibele Road, Anekal -Hosur Road, Anekal Main Rd, Huskur Main Rd, Kaggalipura Rd & Begur Koppa Road. Bangalore-Salem Railway line is also marked.
- The US EPA (1996) estimates that up to half of suspended solids and a sixth of hydrocarbons reaching streams originate from freeways.
- Vehicle-related particulates in highway runoff come mostly from tire and pavement wear (about a third each), engine and brake wear (about 20%), and exhaust (about 8%).
- Each year, millions of gallons of improperly discharged used motor oil pollute streams, lakes, and coastal areas. It should be a cause for concern since one gallon of used oil can contaminate one million gallons of water.
18. Ground Water: Since 2009, Central Ground Water Board has been classifying Anekal Taluk’s ground water as over exploited. ( 2009, 2014, 2020)
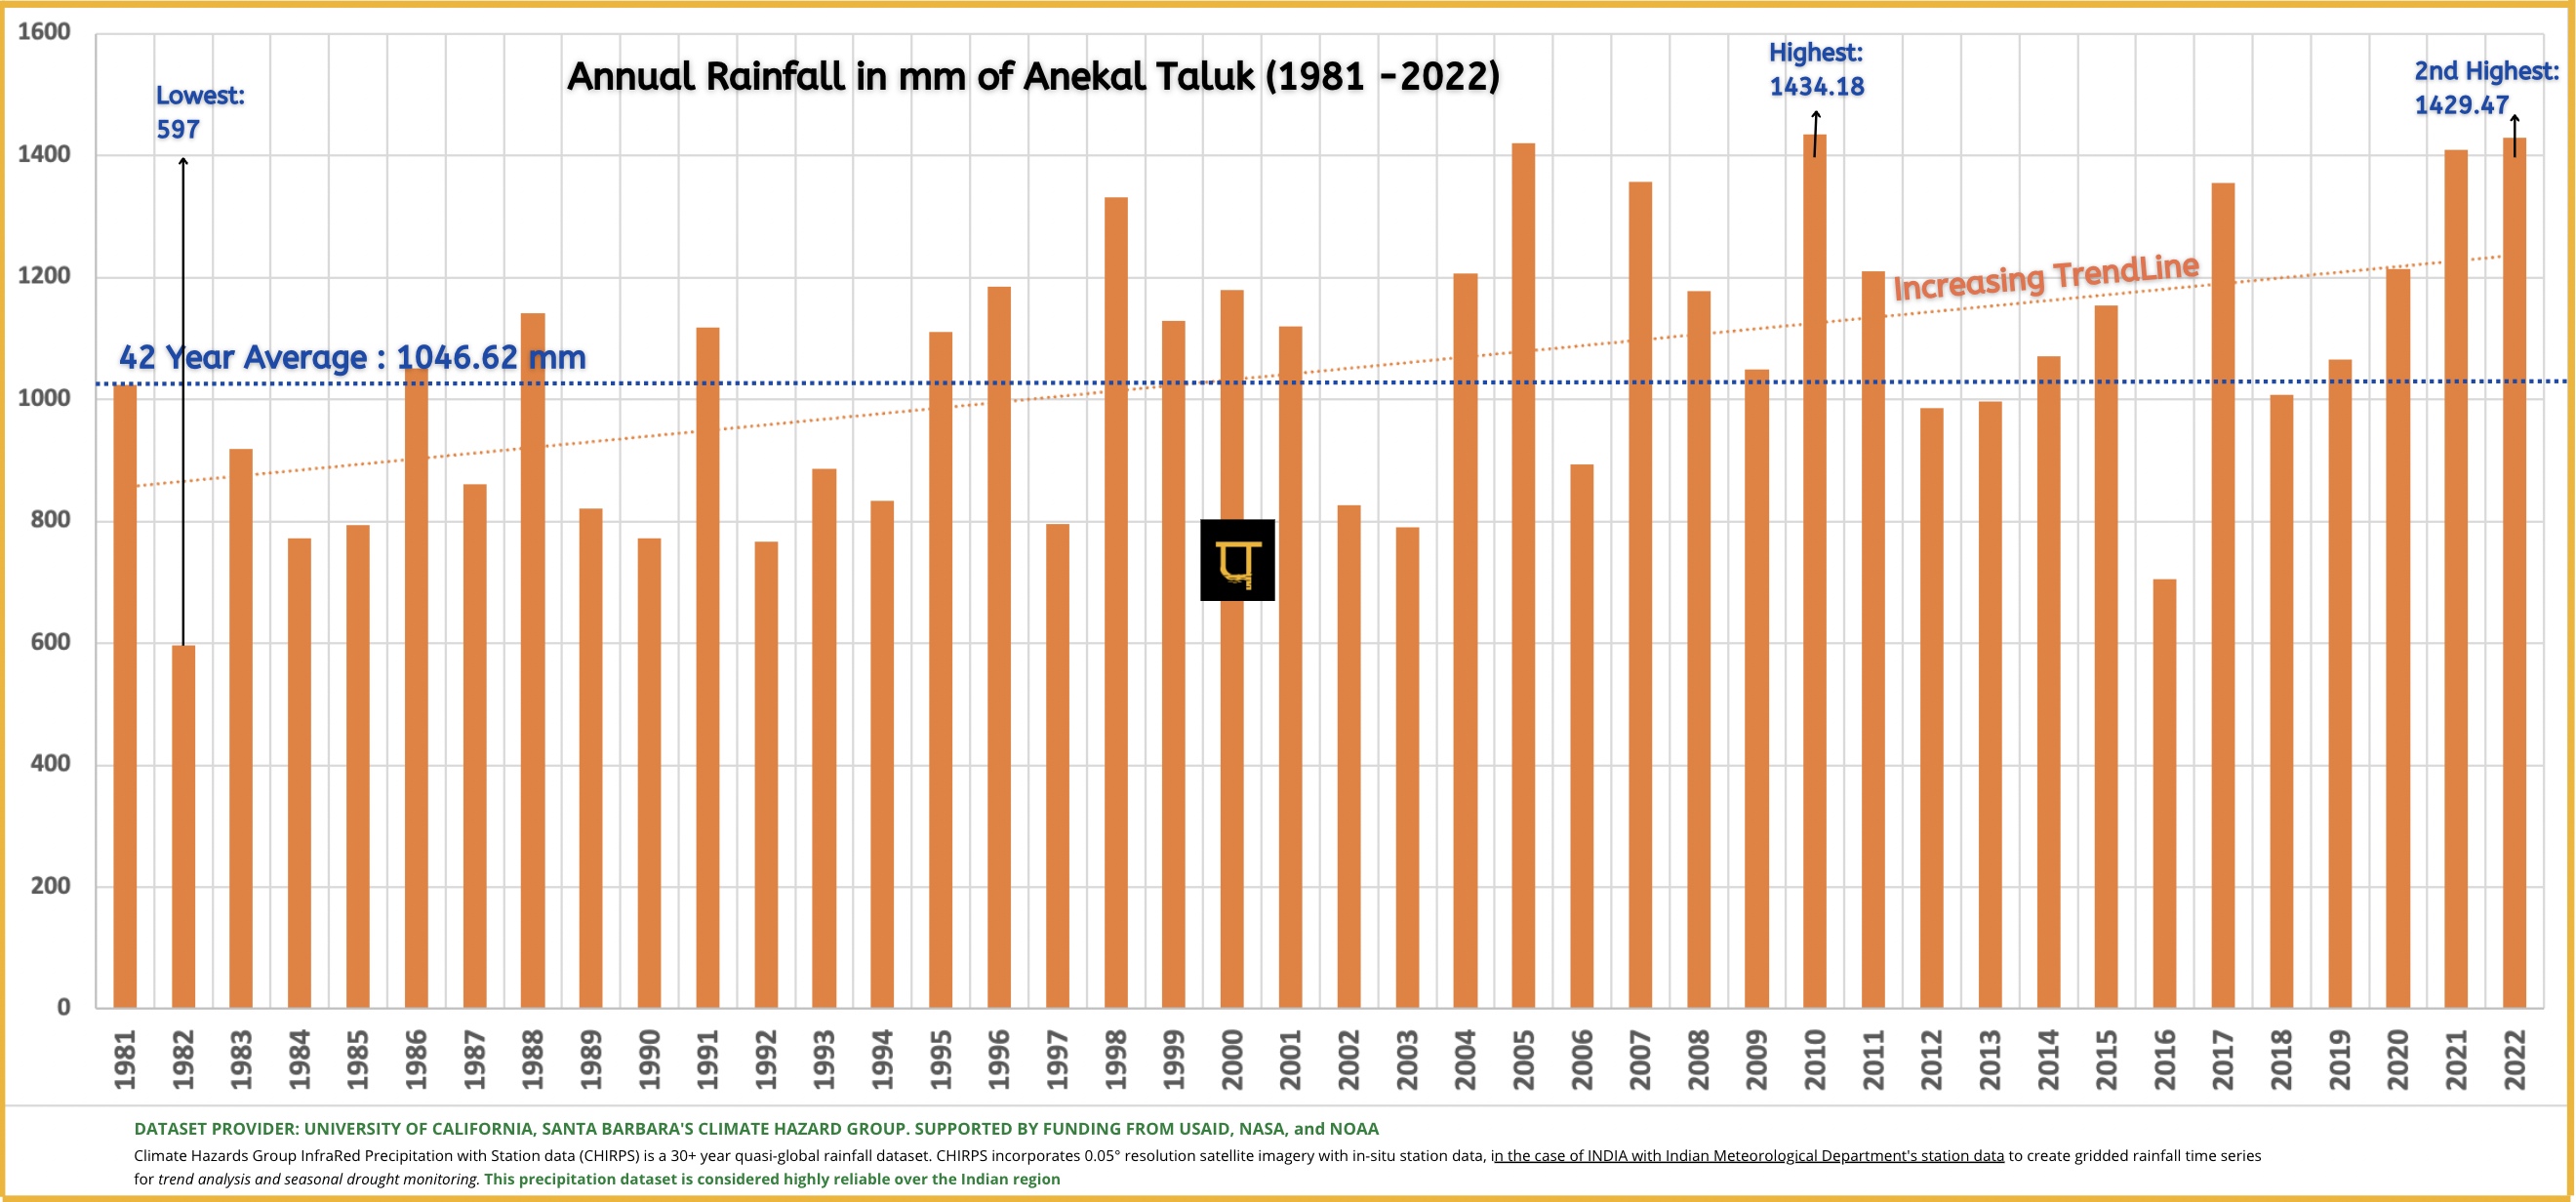
19 Rainfall: Yearly total rainfall is sourced from CHIRPS.
- The rainfall shows an increasing trend with a 42-year average at 1046mm.
- The highest annual rainfall of 1434mm was in year 2010 year, with the second highest being 1429 mm in 2022.
- The lowest annual rainfall is recorded at 597mm in 1982.
Frequently Asked Questions:
- Why do the lake shapes not match the lake shape on revenue’s survey records?
The lake shapes are obtained from Karnataka State Remote Sensing Application Centre’s (KSRSAC) Karnataka Geographic Information System (K-GIS). KSRSAC has created the shapes by remote sensing, meaning the shapes are drawn using satellite images based on water spread. As K-GIS dataset is widely used, the same shapes get repeated across different maps.
These shapes only serve the purpose of indicating the presence of the lake on the map and is not usable to determine lake boundary.
- Can we use the map in judicial matters?
The map-data can be used in judicial matters to give a macro-level view to the court before diving deep into your particular issue. It will aid the court in understanding the magnitude of the case. As part of Bangalore Environment trust, we have used hand-drawn maps as part of our Public Interest Litigations (PIL). We also know of other PILs, where our hand-drawn map is used.
We have made every effort to ensure the data is accurate and have published all the references used. However, to protect ourselves, we must say: Any use of the map-data is at your own risk and that Paani.Earth as the creator of map-data, is not liable for any adverse outcomes.
——
Paani.Earth is licensed under a Creative Commons Attribution-NonCommercial-ShareAlike 4.0 International License
